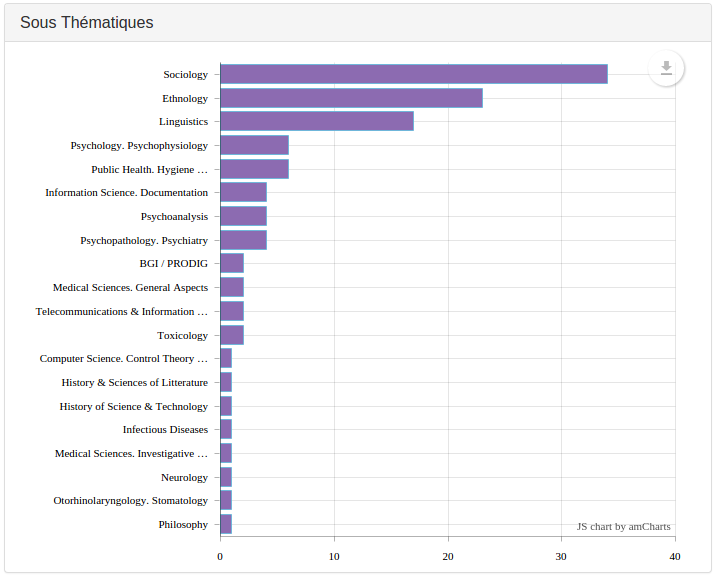
Used to display the number of documents associated to a field value (for example, for keywords: how many documents match a keyword?). Bars are sorted by descending number of documents.
Possible configuration: size, color, and maxItems.
maxItems limits the number of bars to its value (default value: 100).
If you want to shorten the field value to display on the chart, use an associative array to replace too long fields values with shorter ones:
      {
        "field": "fields.Themes",
        "type": "horizontalbars",
        "title": "Themes (bars)",
        "maxItems" : 10,
        "labels": {
          "Biology & Biochemistry"    : "Bio & Bio",
          "Pharmacology & Toxicology" : "Pharmaco & Toxico",
          "Plant & Animal Science"    : "Plant & Animal"
        }
      },