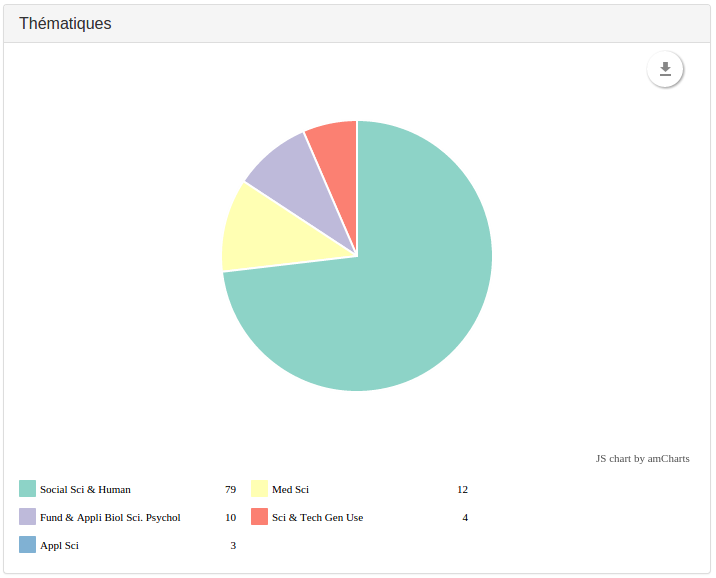
Used to fill the pie chart quarters.
There are some configuration possible: size of the pie,
colors of the slices, and position of the legend.
You can also use groupPercent: if there is more than one slice whose
percentage of the pie is less than this number, those slices will be grouped
together into one slice. This is the "other" slice. It will always be the last
slice in a pie.
To name the possible grouped slice, use groupedTitle.
To remove the labels around the slices, set removeLabels to true.
If you want to shorten the field value to display in the legend, use an associative array to replace too long fields values with shorter ones:
      {
        "field": "Thematique",
        "type": "pie",
        "title": "Themes (pie)",
        "labels": {
          "Clinical Medicine": "Clinic",
          "Biology & Biochemistry": "Bio",
          "Neurosciences & Behavior": "Neuro"
        }
      },